7 The t-test of Means
A t-test of means is used to determine whether the means of two sample groups are different.
7.1 The t value
In section 5 of the Statistics Guide, we saw how 95% confidence intervals could be used to test whether the sample means of two groups were significantly different. That method had certain deficiencies, one of which was that it did not provide an explicit value for P. Another alternative is the t-test of means, which is a straightforward way to assess whether the difference between two means is significant. It is used for comparing the means of two samples in which an individual from one group is not related to a particular individual in the other group.
The heart of the t-test is the calculation of a statistic known as the "t value" or "t-stat". The formula for the t value associated with two sample means is:
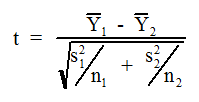 Equation 5
where the Y's are the individual measurements and is a sample mean. s is the sample standard deviation and n is the sample size. The subscript ones and twos indicate the first group and the second group respectively. By convention, the larger mean is assigned the value of to avoid a negative value of t, but some statistical software does not do this, and thus produces negative values for t. In that case, simply take the absolute value of the listed t.
In the discussion about the effectiveness of a new version of a blood pressure drug (Section 4.4 and 5.2), the challenge was to make a choice between the scenario in which the differences in sample means represented actual differences between the true mean responses to the two drugs (the alternative hypothesis), and the scenario in which the true mean responses to the two drugs were actually the same, but by chance we had obtained unrepresentative samples, causing the sample means to differ (the null hypothesis). Our ability to choose between these two alternatives depends on the size of the differences that we are measuring, and on the degree to which our calculated means differ from their true values because of the influence of population variation on our sampled values.
An examination of Equation 5 shows that it produces a value that takes into consideration both of these things. The numerator evaluates the size of the difference between the two sample means. A greater difference in the means in the numerator produces a larger value of t. The denominator is actually the formula for the standard error of the difference between the means. Recall that a standard error (e.g. standard error of the mean) estimates the variation of a sampled quantity from its true value. Just as was the case for the standard error of a single mean, the size of this standard error of the difference of means depends on how many measurements we made (n) and how variable the measurements were (the standard deviation, s). When the measurements are more variable (i.e. a bigger s), our samples are less likely to be representative, our standard error is bigger, and the calculated t is smaller. When our sample size increases (i.e. a bigger n), we are more confident that our sample is representative because the variation in individual measurements tend to cancel out - leading to a smaller standard error and a larger value of t. Thus you can see that the formula for t includes all of the factors that affect our ability to assess whether differences are real or whether they have resulted from chance unrepresentative sampling: the size of the differences, the variability in the population, and the sample size of our experiment.
Another way of visualizing t is to think of it as the difference between the sample means weighted by our uncertainty in the measurement. A certain size of difference is weighted more highly if we trust our measurements more (i.e. we have a smaller standard error). By weighting in this manner, we have created a statistic that can be used to assess differences of any type that is not dependent on the scale that we used to measure them. As a reflection of this, if t is calculated from quantities having units, it can be seen that the result is unitless (i.e. the units cancel out).
7.2 Relationship between t and P
Although we now have a standardized scale of assessing differences in means, we need some way of relating this scale to P-values. Statisticians have derived methods for calculating the probability that t values greater than a certain size would occur by chance in the situation where the two groups are actually the same (i.e. the null hypothesis is true). The calculation of P-values is complicated by the fact that the number of degrees of freedom (df) in the test must be considered. Degrees of freedom is an integer number representing the number of independent pieces of information that are used to estimate a statistical parameter. In the context of a t-test, we can think of degrees of freedom as being related to the sample size. For the t test, the number of degrees of freedom is: df = (n1-1) + (n2-1).
Because of its complexity, the calculation of P is not easily done by hand. Software with statistical capabilities such as Excel can calculate and state the value of P. A user can examine whether P is more or less than 0.05. If P is less than 0.05, then the sample means are significantly different.
7.3 Performing a t-test of Means Using Excel
Note: to calculate the descriptive statistical values in this section, you must have enabled the Data Analysis Tools in Excel. Go to the Excel Reference home page for instructions for PC and Mac.
To perform a t-test of means, click on the Data ribbon. Click on Data Analysis in the Analysis section. Select t-Test: Two-Sample Assuming Equal Variances, then click OK. Click on the Input 1 Range selection button, then select the range of cells for the column that contains the measured values for the sample from the first group. Click on the Input 2 Range selection button, then select the range of cells for the column that contains the measured values for the sample from the second group. To put the results on the same sheet as the column of numbers, click on the Output Range radio button then click on the selection button. Click on the upper left cell of the area of the sheet where you would like for the results to go. Then press OK. The t value is given in the "t Stat" row. As noted in Section 7.1, the value may be negative depending on which column was selected as "1" and which was selected as "2". The P-value is listed in the " P(T<=t) two-tail" row. It may be listed in scientific notation if its value is very small.
