11 Reporting the Results of a Statistical Test
In the scientific literature, there are standardized ways of reporting the results of statistical tests. In the case of a simple test, the results may be referred to parenthetically in the text. If the test is more complex or if there are multiple tests, the results may be organized in a table. The following items should always be included in reporting the results of a test: the calculated value of the statistic (which varies depending on the test - in a t-test the calculated value of t would be reported), the number of degrees of freedom (i.e. df) if appropriate for the test, and an indication of the value of P. In many cases, the actual value of P as calculated by statistical software is reported. In other cases, symbols are used to indicate that a particular quantity in a table is significant at a certain P level. For example, an asterisk (*) is often used to indicate that P<0.05 and two asterisks (**) is often used to indicate that P<0.01. "NS" is used to indicate "not significant". When such symbols are used in a table, it is expected that a key will explain the symbols. Other quantities are sometimes included as appropriate.
Here is an example showing how values for a statistical test might be reported as part of the text in a results section:
"A chi-squared analysis showed a significant difference between distance and the water temperature (χ2=7.4, df=1, P=0.007)."
Here are the specific quantities that should be reported for the tests we have or will have learned about in this class:
t-test of means: t ("t Stat"), df (degrees of freedom), and P ("P(T<=t) two-tail")
paired t-test: t ("t Stat"), df (degrees of freedom), and P ("P(T<=t) two-tail")
regression: slope (this is the statistic for regression), N (sample size; "Observations), and P (P-value for the non-intercept quantity). Note: If the equation for the best-fit line is reported, then the slope is included and it is not necessary to report it separately. It is also typical to report R2.
(will cover in 1511L) chi-squared contingency test: χ2, df, and P
(will cover in 1511L) chi-squared goodness of fit test: χ2, df, and P
(will cover in 1511L) ANOVA: The reporting of the results of ANOVA is complicated. See the specific instructions for the test.
Specific examples for the tests
t-test of means or paired t-test: t=0.709, df=26, P=0.485
(will cover in 1511L) chi-squared contingency test: χ2=7.4, df=1, P=0.007
(will cover in 1511L) chi-squared goodness of fit test: χ2=6.65, df=2, P=0.036
regression: slope= -7.25 mW/h, N=15, R2=0.894, P=0.029 The slope should be expressed with the correct units. Alternatively, the entire equation of best fit can be stated rather than just the slope.
(will cover in 1511L) ANOVA: The results are typically reported in the form of a table with a row for each source of variability (the experimental factor(s) and the error term) and the totals.
|
Source |
Degrees of freedom |
Sum of squares |
Mean square |
F ratio |
P |
|
Soap |
1 |
4704500 |
4704500 |
7.1 |
0.0164 |
|
Triclosan |
1 |
264500 |
264500 |
0.40 |
0.536 |
|
Error |
17 |
11280500 |
663559 |
|
|
|
Total |
19 |
16249500 |
|
|
|
Note: since it is possible to calculate some values in the table from others, sometimes the totals or the mean square may be omitted.
Figs. 12-14 in Sections 5.4 and 5.5 of the BSCI 1510L course guide provide examples showing various ways to present the results of multiple tests in a meaningful way. In a scientific paper, raw data are usually not published in the paper if it is possible to summarize them in graphically or through the use of summary statistics. In some cases, the raw data are published as an online appendix if they might be valuable as the starting point of additional analyses. For homework, you will usually need to present your raw data in an organized fashion so that the grader can determine the nature of mistakes that you might have made.
Here is an example of a table which presents the results of a more complex test:
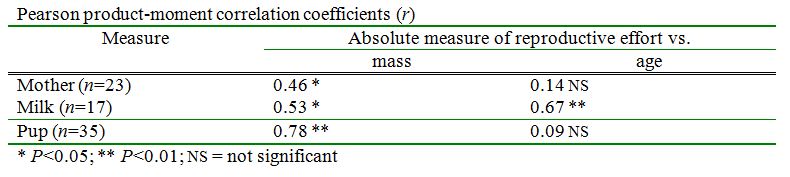
Note that even though neither of these tests are ones that we have learned this semester, the fact that the results report the P-value (or give an indication of its size) allow you to know whether particular factors were found to have a significant effect.
It is never appropriate to copy and paste the raw output of statistical software into either homework or published work, unless an assignment specifically asks you to show this work. Typically, such output includes extraneous information that is not relevant to the analysis. You should clearly present the components of the analysis that are relevant to the conclusions you will draw from the data.
Citations of statistical tests: It is usually not necessary to provide a citation for most of the simple statistical tests (e.g. t-test of means, ANOVA, and simple linear regression) that we have learned. If you use other tests, you should cite the text or reference you followed to do the test. It is also customary to cite the statistical software used to conduct the analysis (e.g. JMP, Excel, MatLab, R, etc.).
