Setup
It is assumed that you already have R and RStudio set up on the computer that you are using. See Section 6 if you need to install them. It is also assumed that you have done the example in Section 0.2.1 and are familiar with pasting a script into the Source Editor pane and running it.
Data format
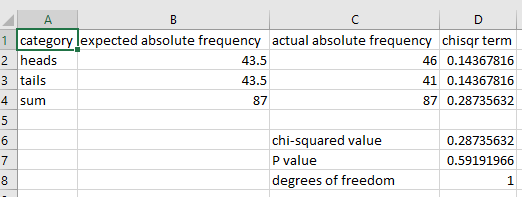
When running a chi-squared goodness of fit test using R, the actual frequencies (i.e. the observed frequencies) must be absolute (i.e. counts). The expected frequencies must be relative (i.e. the probabilities or proportions expressed as decimal fractions). This differs from the way the test is conducted in Excel where both the actual and expected frequencies must be absolute. For example, the Excel example in section 1.5 looks like this:
whereas the values used in R would be:
| category | expected relative frequency | actual absolute frequency |
| heads | 0.5 | 46 |
| tails | 0.5 | 41 |
Example script
Here is a script that uses the data shown above:
# chi-squared goodness of fit test testing whether coin flips differ significantly from what we expect
observedFlips = c(46, 41)        # actual absolute: (heads, tails)

expectedProb = c(0.5, 0.5)      # expected relative: (heads, tails)
chisq.test(

  x = observedFlips,

  p = expectedProb,

)
When pasting the script into RStudio, use the raw text from this GitHub gist rather than copying and pasting from this page. Note that although it would be possible to input the data from a file, it probably isn't worth it in this case, since only four numbers need to be typed into the script.
If there are more than two categories, simply include more numbers within the parentheses, separated by commas.
Output
Here is the output given by R:
Chi-squared test for given probabilities
data:  observedFlips

X-squared = 0.2874, df = 1, p-value = 0.5919
Notice that this conforms to the expectations about what is normally reported for a statistical test: the value of the statistic (chi-squared value), the number of degrees of freedom, and the P-value.
Reference
For other options and examples, see the Chi-square Test of Goodness-of-Fit page in An R Companion for the Handbook of Biological Statistics.
