2.4 Conducting a chi squared contingency test using Excel
Step 1. Calculate actual relative frequencies for each outcome. Begin by creating a table that contains the actual absolute frequencies (similar to Table 11), then use those frequencies to calculate the totals and relative frequencies of the outcomes for the separate categories.
Fig. 2. Calculation of actual relative frequencies from actual (observed) joint absolute frequencies
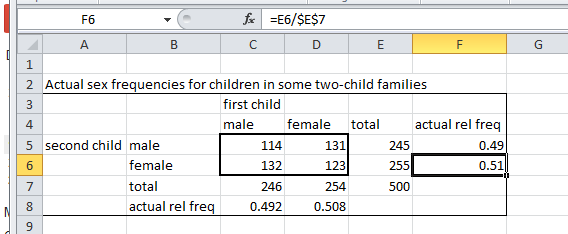
In the Fig. 2, you can see that the relative frequency was calculated by dividing two other cell references in the spreadsheet. This is preferable to dividing the numbers themselves, since this allows you to change the actual absolute frequencies and Excel will recalculate all of the other values without further action on your part. Note the use of dollar signs in the cell reference to create an unchanging reference to the total counts, so that the formula in F5 could be copied into F6. This doesn't save much time in a 2x2 table, but might if there were more than two categories.
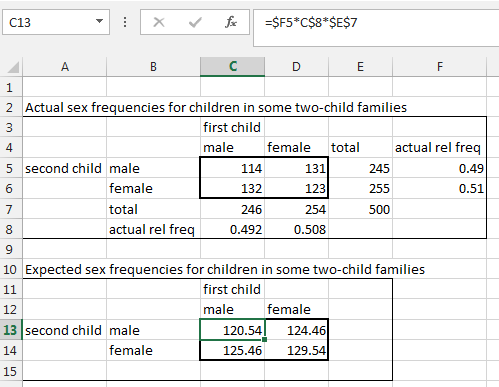
Step 2. Calculate the expected absolute frequencies for combinations. Create a second table to hold the expected absolute frequencies (Fig. 3). The spreadsheet shown in Fig. 3 combined the steps shown in Tables 12 and 13 by calculating the joint probabilities and multiplying by the total count in a single formula (shown for cell C13). Again, note the use of dollar signs to hold row or column references constant when the formula is copied. This allowed a single formula to be used for all four cells in the second table.
Fig. 3. Calculation of expected absolute frequencies for sex combinations
Step 3. Calculate the chi squared value. We now have the two tables necessary to conduct the test: a table of actual absolute frequencies and a table of absolute frequencies that would be expected given the existing relative sex frequencies under the hypothesis of independence. Create a third table that calculates the chi squared terms needed to calculate the overall chi squared value for the contingency test. In Fig. 4, a formula was created in cell C18 to calculate the chi squared term for the male/male combination. No dollar signs were used because we want the cell references to be relative to the position in the table and allow for copying and pasting (or use of the fill handle). After calculating the four chi squared term values for the four possible combinations, they were summed to calculate the overall chi squared value in cell D20. Because this is a 2x2 contingency table, the number of degrees of freedom is 1.
Fig. 4. Calculation of the chi squared value for the contingency test
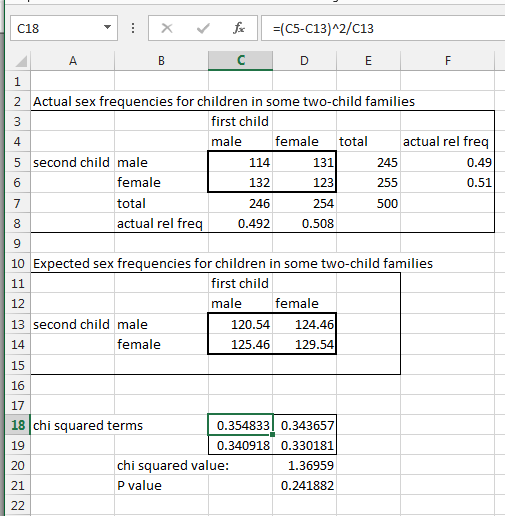
Step 4. Calculate the P-value. The P-value for the contingency test was calculated in cell D21 (Fig. 4) using the CHISQ.TEST function as in section 1.5 . The difference in this case is that the parameters of the function ranged in two dimensions (rows and columns) rather than one (rows only), producing the formula =CHISQ.TEST(C5:D6,C13:D14).
Step 5. Report the results. It is standard practice to report the value of the statistic, the number of degrees of freedom, and the P-value. In this case, the results could be reported as follows:
"There was no significant relationship between the sex of the first child and the sex of the second child (χ2=1.37, df=1, P=0.242)."
2.5 Extensions
There is no reason for the tested relationships to be limited to two states per factor. For example, one could test whether the factor "outcome of a dice roll" (states: 1 through 6) depended on whether it was rolled by a professional gambler or a normal test subject (factor "type of person rolling" with states: "gambler" and "normal"). In this case, the contingency table would be 2x6 and the number of degrees of freedom would be (2-1)(6-1)=5. The setup in Excel would be the same as in section 2.4 except that there would be 6 rows instead of 2.
The Likelihood Ratio test is another way of testing for association and is preferred by many statisticians over the chi-squared test. However, it usually produces very similar results to the chi-squared test.
The contingency test only assesses whether there is a significant deviation from independence. It provides no information about the nature of the deviation. If there is a significant association, there are additional methods for assessing the nature of the association (e.g. whether the association is positive or negative).
The chi squared contingency test is limited to outcomes that can be counted, as opposed to outcomes that are measured as continuous values. There are more sophisticated tests that are less restrictive. For example, logistic regression allows more than two factors to be assessed and allows factors to have either count or continuous values.
